California nursing school data for journalists
Key statistics, downloadable tables, citation formats and embeddable charts, all compiled from public California Board of Registered Nursing records. Free to use with credit.
Key statistics
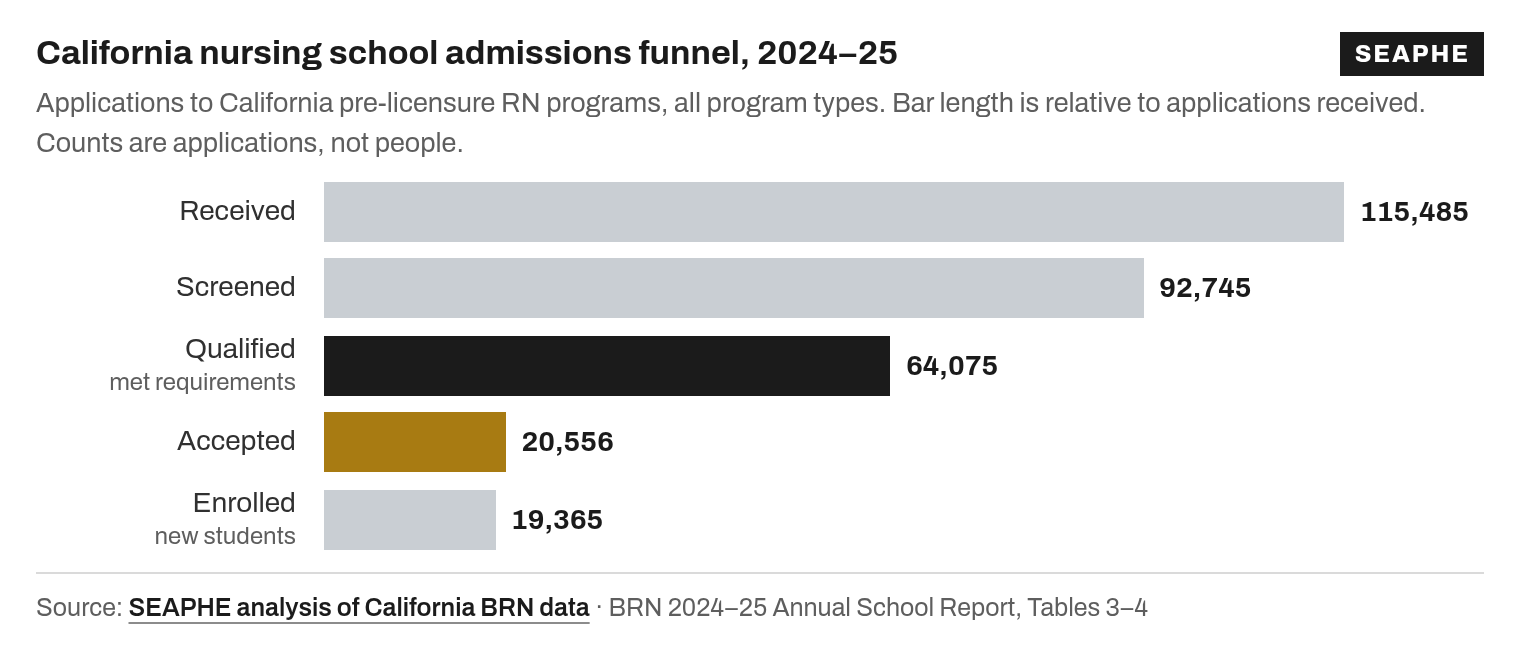
About two of every three qualified applications to California pre-licensure RN programs were not accepted in 2024–25: 43,519 of 64,075.
Source: CA BRN 2024–25 Annual School Report, Table 3, p. 3
Only 32.1% of 64,075 qualified applications to California pre-licensure RN programs were accepted in 2024–25 (20,556 acceptances).
Source: CA BRN 2024–25 Annual School Report, Table 3, p. 3
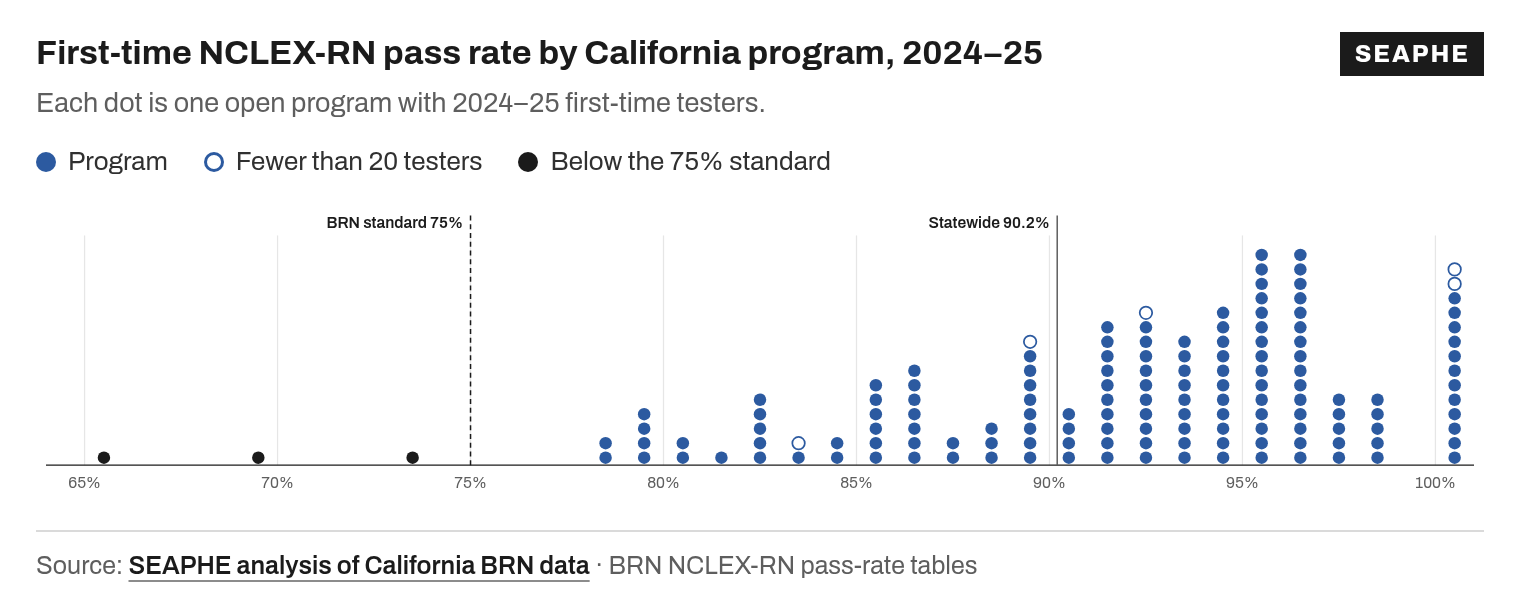
In 2024–25, 90.2% of 15,874 first-time NCLEX-RN testers from 154 California programs passed (SEAPHE tester-weighted calculation).
Source: CA BRN NCLEX-RN pass-rate tables
SEAPHE counts 162 open pre-licensure RN programs on the California Board of Registered Nursing's approved list, excluding closed programs and those not accepting new students.
54 of 149 open programs with 2024–25 first-time testers had a pass rate of 95% or higher; 5 were below the BRN’s 75% standard.
Source: CA BRN NCLEX-RN pass-rate tables
By degree type in 2024–25, first-time pass rates were 92.1% for ADN, 89.0% for BSN and 88.3% for entry-level master’s (ELM) graduates.
Source: CA BRN NCLEX-RN pass-rate tables
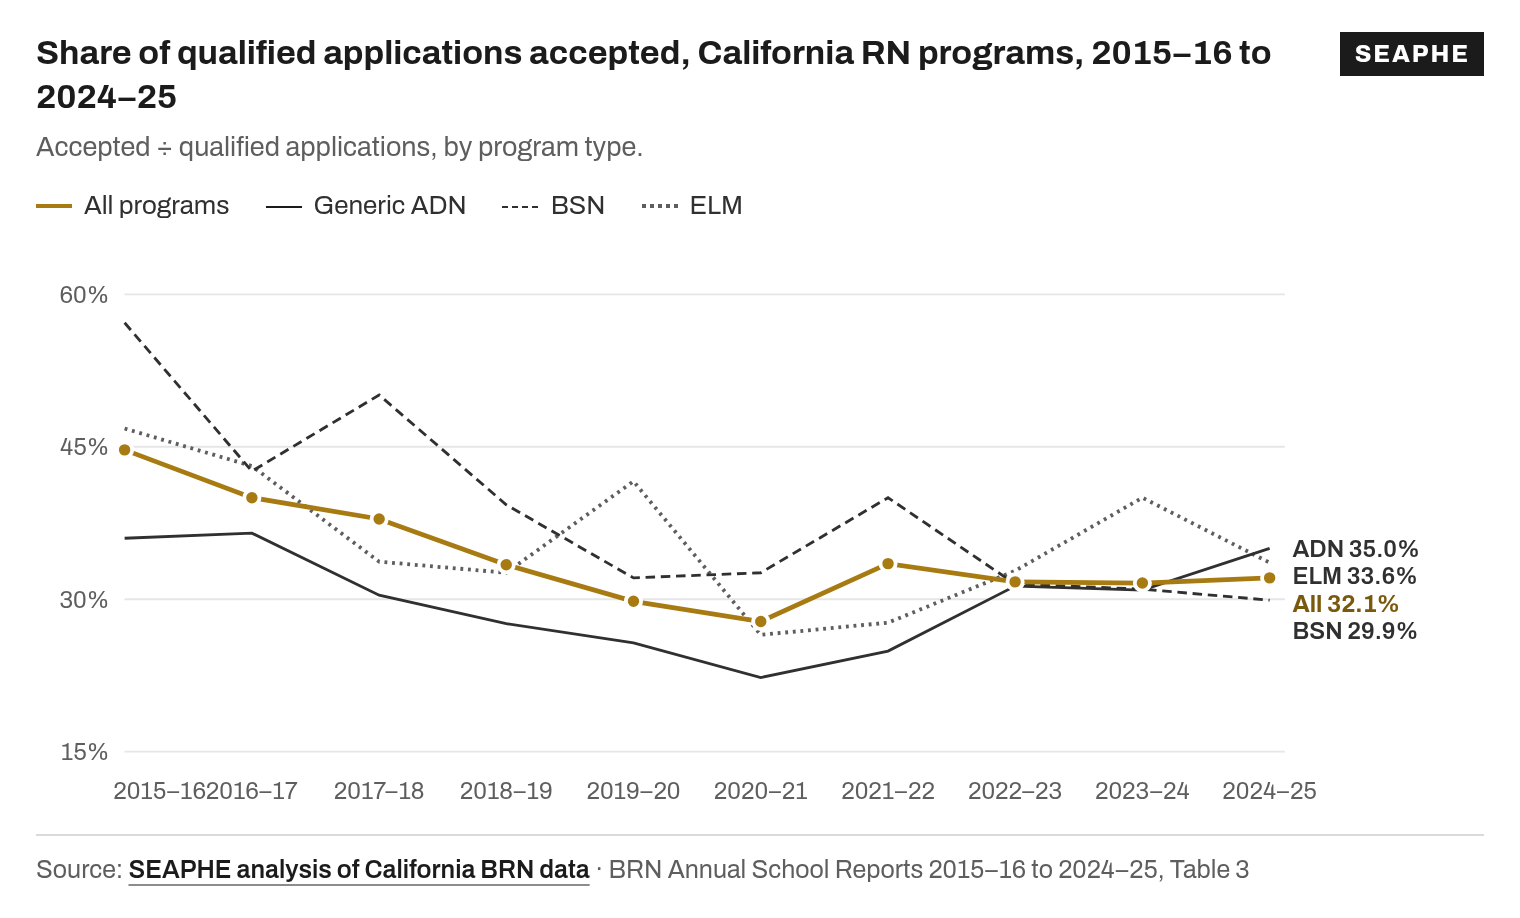
In 2024–25, BSN programs accepted 29.9% of qualified applications, generic ADN programs 35.0%, ELM programs 33.6% and LVN-to-ADN programs 56.2%.
Source: CA BRN 2024–25 Annual School Report, Table 3, p. 3
The share of qualified applications accepted fell from 44.7% in 2015–16 to a low of 27.8% in 2020–21, and was 32.1% in 2024–25.
Source: CA BRN 2024–25 Annual School Report, historical trends
Qualified applications rose from 28,041 in 2015–16 to 64,075 in 2024–25, while new student enrollments went from 13,190 to 19,365.
Source: CA BRN 2024–25 Annual School Report, historical trends
Download the data
- Key statistics (CSV)Every figure above, with value, unit, period and source URL.
- NCLEX pass rates by program (CSV)One row per program: first-time testers and pass rate, 2020–21 to 2024–25. JSON
- Applications and acceptances (CSV)Received, qualified and accepted applications by program type, 2015–16 to 2024–25. JSON
How to cite
Please credit SEAPHE and, where you can, the original BRN source. In running text, “according to a SEAPHE analysis of California Board of Registered Nursing data” works well.
Charts you can embed
Each chart has an “Embed this chart” button with iframe and PNG code, including a visible credit link.
- California nursing school admissions funnel, 2024–25On the admissions page. Preview embedPNG
- Share of qualified applications accepted, California RN programs, 2015–16 to 2024–25On the admissions page. Preview embedPNG
- First-time NCLEX-RN pass rate by California program, 2024–25On the home page. Preview embedPNG
- Per-school NCLEX trendOn every program page with NCLEX results.
Programs can also display a pass rate badge when they qualify under our published rules.
Before you publish
- Applications, not people. One applicant often applies to several programs, so acceptance figures count applications.
- No school-level acceptance rates. The BRN publishes acceptance rates statewide by program type, not for individual schools.
- Small cohorts swing. A program with 15 testers can move 10 points on one or two results. Check tester counts and five-year averages.
- Our calculations are labeled. Statewide and multi-year pass rates are SEAPHE tester-weighted calculations from BRN program tables. See our methodology.
Contact
Questions about the data or methodology: hello@seaphe.org. To report an error: corrections@seaphe.org (see our corrections policy).