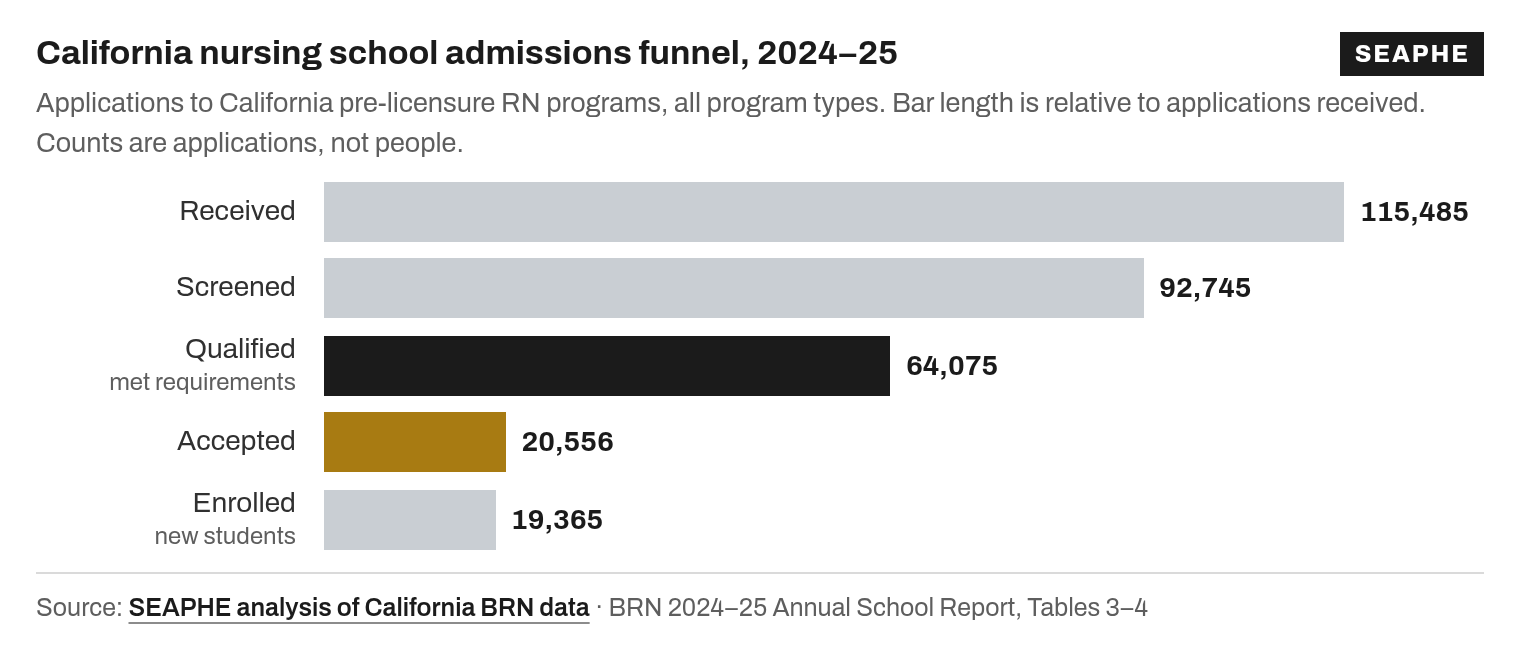
Acceptance rates by program type, 2024–25
BSN programs drew the most qualified applications and accepted the smallest share. LVN-to-ADN programs, which admit licensed vocational nurses only, accepted the largest share but are a tiny pool.
- Associate degree (generic ADN)89 programs · 22,970 qualified · Community colleges and some private schools. Excludes LVN-to-ADN.35.0%
- Bachelor’s (BSN)48 programs · 37,452 qualified · Includes LVN-to-BSN applicants, as the BRN reports them.29.9%
- Entry-level master’s (ELM)14 programs · 3,322 qualified · For people who already hold a bachelor’s in another field.33.6%
- LVN-to-ADN5 programs · 331 qualified · Programs that admit licensed vocational nurses only.56.2%
| 2024–25 | ADN | LVN-to-ADN | BSN | ELM | All programs |
|---|---|---|---|---|---|
| Applications received | 44,907 | 443 | 64,923 | 5,212 | 115,485 |
| Screened | 35,858 | 419 | 52,114 | 4,354 | 92,745 |
| Qualified | 22,970 | 331 | 37,452 | 3,322 | 64,075 |
| Accepted | 8,043 | 186 | 11,210 | 1,117 | 20,556 |
| % of qualified accepted | 35.0% | 56.2% | 29.9% | 33.6% | 32.1% |
| New students enrolled | 8,237 | 184 | 10,014 | 930 | 19,365 |
| % of accepted who enrolled | 102.4% | 98.9% | 89.3% | 83.3% | 94.2% |
| Admission spaces available | 8,044 | 189 | 10,506 | 985 | 19,724 |
Sources: BRN 2024–25 Annual School Report, Table 3, p. 3 (PDF p. 8); Table 4 and Table 5, p. 4 (PDF p. 9); program counts from Table 2, p. 3. Generic ADN programs enrolled more students than they accepted (102.4%), which the BRN attributes to waitlist admissions and LVNs placed into open second-year seats. One BSN program and one ELM program (on teach-out) reported no applicants.
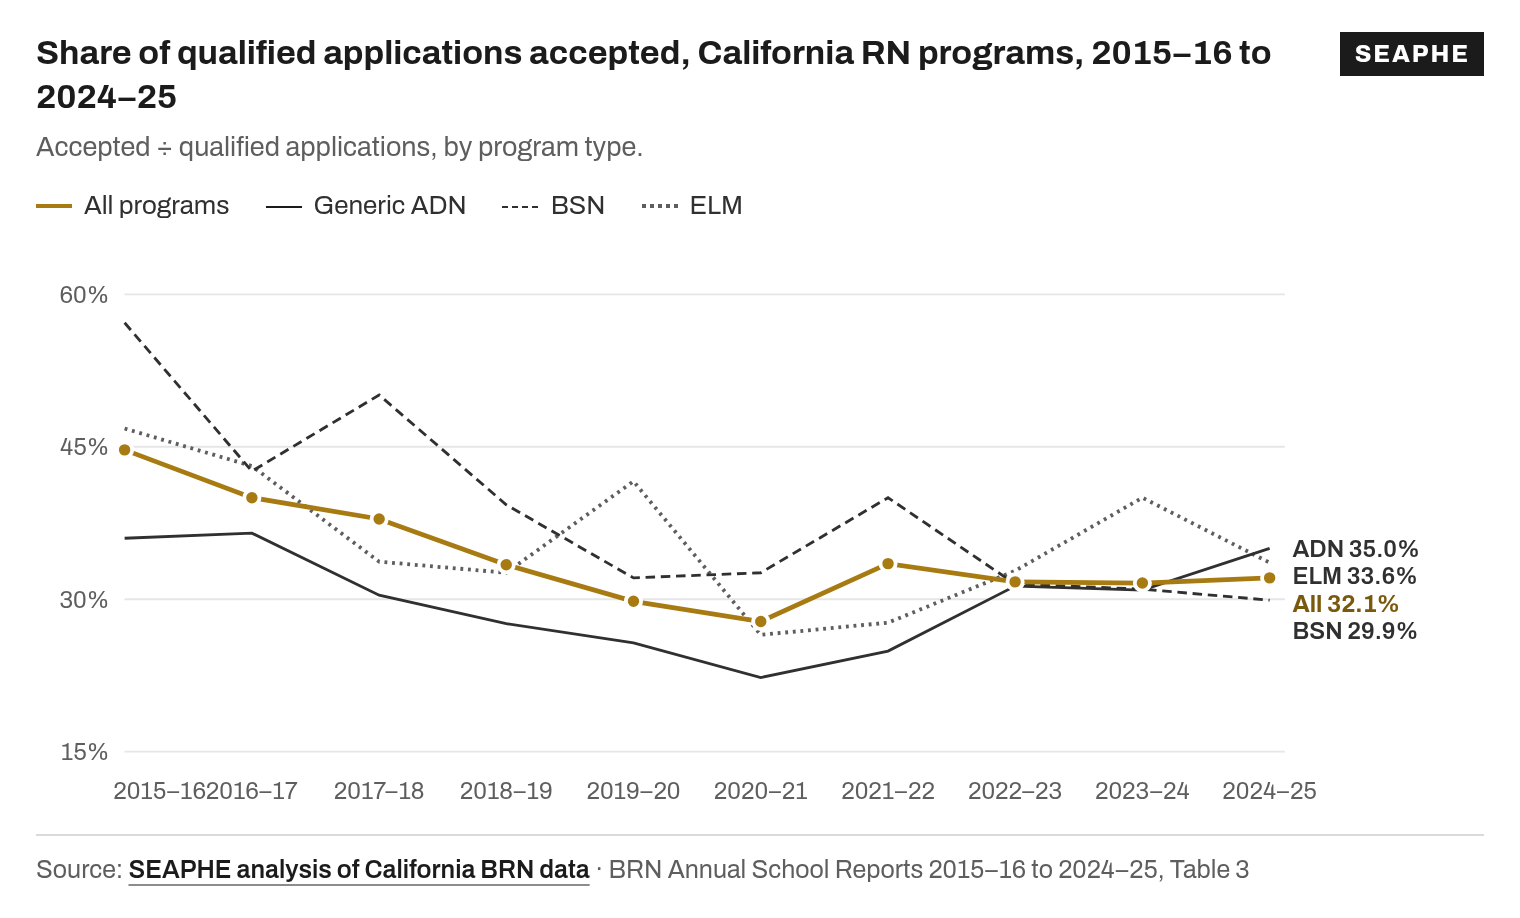
Acceptance rates fell sharply, then leveled off near one in three
In 2015–16, 44.7% of qualified applications were accepted. The rate bottomed out at 27.8% in 2020–21, during pandemic cohort cuts, and has stayed between roughly 31% and 34% since.
Share of qualified applications accepted, 2015–16 to 2024–25
Embed this chart
Free to republish with the credit line and link to SEAPHE. The iframe updates when our data does; the image is a fixed snapshot.
| Year | Qualified apps | Accepted | All | ADN | LVN-ADN | BSN | ELM | Source |
|---|---|---|---|---|---|---|---|---|
| 2024–25 | 64,075 | 20,556 | 32.1% | 35.0% | 56.2% | 29.9% | 33.6% | p. 3 |
| 2023–24 | 60,441 | 19,095 | 31.6% | 30.9% | 58.5% | 31.0% | 40.0% | p. 3 |
| 2022–23 | 57,987 | 18,367 | 31.7% | 31.3% | 61.6% | 31.5% | 32.8% | p. 3 |
| 2021–22 | 64,299 | 21,532 | 33.5% | 24.9% | 42.3% | 40.0% | 27.7% | p. 3 |
| 2020–21 | 55,551 | 15,435 | 27.8% | 22.3% | 77.0% | 32.6% | 26.5% | p. 3 |
| 2019–20 | 54,823 | 16,356 | 29.8% | 25.7% | 57.0% | 32.1% | 41.6% | p. 3 |
| 2018–19 | 47,634 | 15,898 | 33.4% | 27.6% | 49.9% | 39.3% | 32.6% | p. 3 |
| 2017–18 | 38,359 | 14,538 | 37.9% | 30.4% | 44.3% | 50.1% | 33.7% | p. 3 |
| 2016–17 | 36,004 | 14,416 | 40.0% | 36.5% | 68.2% | 42.6% | 43.1% | p. 3 |
| 2015–16 | 28,041 | 12,523 | 44.7% | 36.0% | 66.3% | 57.2% | 46.8% | p. 3 |
Each row uses the figures as first published that year. Later BRN reports revised a few counts (for example, 2017–18 qualified applications appear as 38,425 in the 2024–25 trend report versus 38,359 originally). The 2019–20 report’s summary text gives 83,603 as the qualified total, but its Table 3 lists 83,603 as applications received and 54,823 as qualified; we use the table. Download this data (CSV).
Qualified applications more than doubled. Seats grew far less.
The BRN’s trend report counts 64,075 qualified applications in 2024–25, up from 28,041 in 2015–16 (an estimated 128.5% increase). New student enrollments rose from 13,190 to 19,365, a 46.8% increase and a ten-year high. In 2024–25, 69.6% of qualified applications did not result in an enrollment.
Qualified applications vs. new student enrollments
Read this before you panic
“Qualified applications” are not the same as applicants
The BRN counts applications, not people. Most applicants apply to several programs, and each one counts separately. Someone who applies to six schools and gets into one adds six qualified applications and one acceptance to the totals.
That means 32.1% is not your personal chance of getting into nursing school. Your odds of getting at least one offer could be higher or lower, depending on how many programs you apply to and how competitive your application is. Nobody knows the true per-person figure: the BRN states that “it is not known how many individual applicants did not receive an offer of admission from at least one nursing program.”
Two more caveats. “Qualified” means the application met that particular program’s minimum requirements, and those vary from school to school. And programs set their own selection rules, from ranking by points to random lotteries, so the same applicant can have very different odds at different schools.
Source: BRN 2024–25 Annual School Report, Table 3, p. 3 (PDF p. 8), including the table footnote “These data represent applications, not individuals.”
Points, interviews or a lottery: it depends on the program type
| Selection method (share of programs) | ADN | BSN | ELM |
|---|---|---|---|
| Ranking by specific criteria | 71.1% | 75.0% | 92.9% |
| Interviews | 8.4% | 33.3% | 57.1% |
| Goal statement | 2.4% | 14.6% | 57.1% |
| Random selection (lottery) | 26.5% | 0.0% | 0.0% |
| Modified random selection | 20.5% | 0.0% | 0.0% |
Programs could choose more than one method. The ADN column covers generic ADN programs only; 150 programs reported in total. Source: BRN 2024–25 Annual School Report, Table 47, p. 35 (PDF p. 40).
Source: BRN 2024–25 Annual School Report, Table 48, p. 36 (PDF p. 41). Only programs that keep a waiting list reported these figures.
Read more: how California nursing programs select students, and why most keep no waitlist. For one competitive campus in depth, see SDSU nursing acceptance rate: what SDSU publishes.
Regional demand (latest BRN regional data: 2015–16)
Dated data. The BRN’s nine regional school reports were last published for 2015–16, and they report qualified applications and enrollments, not acceptances. We show them for context only. Regional patterns may have changed a lot since then.
| Region (2015–16) | Qualified apps | New enrollments | % qualified apps not enrolled | Source |
|---|---|---|---|---|
| Los Angeles AreaLos Angeles and Ventura | 9,635 | 5,018 | 48.0% | Regional report, p. 4 |
| Bay AreaAlameda, Contra Costa, Marin, Napa, San Francisco, San Mateo, Santa Clara, Santa Cruz, Solano, and Sonoma | 5,895 | 2,349 | 60.2% | Regional report, p. 4 |
| Inland EmpireOrange, Riverside and San Bernardino | 3,611 | 2,015 | 44.2% | Regional report, p. 4 |
| San Joaquin ValleyFresno, Kern, Kings, Madera, Merced, San Joaquin, Stanislaus, and Tulare | 3,065 | 1,276 | 58.4% | Regional report, p. 4 |
| Southern BorderSan Diego and Imperial | 2,390 | 1,354 | 43.3% | Regional report, p. 4 |
| Northern Sacramento ValleyButte, Colusa, Glenn, Shasta, and Tehama | 1,277 | 251 | 80.3% | Regional report, p. 4 |
| Greater SacramentoEl Dorado, Placer, Sacramento, Sutter, Yolo, and Yuba | 1,269 | 563 | 55.6% | Regional report, p. 4 |
| Central CoastMonterey, San Benito, San Luis Obispo, and Santa Barbara | 682 | 226 | 66.9% | Regional report, p. 4 |
| Northern CaliforniaDel Norte, Humboldt, Lake, Lassen, Mendocino, Modoc, Nevada, Plumas, Sierra, Siskiyou, and Trinity | 217 | 100 | 53.9% | Regional report, p. 4 |
Source: BRN 2015–2016 Annual School Report: Data Summary and Historical Trend Analysis, regional editions, “Student Admission Applications” and “New Student Enrollment” tables (p. 4 of each report). Regional qualified applications sum to the 2015–16 statewide total of 28,041. Regional enrollment figures predate later statewide corrections.
Why we don’t show a per-school acceptance rate
The California BRN does not publish acceptance rates or application counts for individual nursing programs. Its annual school survey reports admissions only in aggregate, and its older program-level interactive database stops at 2015–16. We won’t estimate one.
What the BRN does publish for each program is its approved annual enrollment: how many new students the Board has approved it to admit each year. We show that on every school page and in the program finder. For a program’s actual selectivity, ask its admissions office for last cycle’s number of qualified applicants and seats, and whether it uses ranking, a lottery or a waitlist.
Applied to a California RN program? Share how it went in a 2-minute anonymous survey. Once enough people answer, we publish applicant-reported odds by program type and region.
Share your outcomeLargest programs by BRN-approved annual enrollment
| Program | Type | Approved enrollment / yr |
|---|---|---|
| West Coast UniversityBSN · North Hollywood | BSN | 2,880 |
| Unitek CollegeBSN · Fremont | BSN | 855 |
| Marsha Fuerst School of Nursing at Glendale Career CollegeADN · Glendale | ADN | 675 |
| Samuel Merritt UniversityBSN · Oakland | BSN | 632 |
| Azusa Pacific UniversityBSN · Azusa | BSN | 560 |
| Stanbridge UniversityBSN · Irvine | BSN | 460 |
| Concordia University IrvineBSN · Irvine | BSN | 408 |
| Bakersfield CollegeADN · Bakersfield | ADN | 360 |
| American Career CollegeADN · Los Angeles | ADN | 325 |
| Loma Linda UniversityBSN · Loma Linda | BSN | 275 |
Source: BRN Pre-Licensure RN Programs list, retrieved Oct 7, 2026. Approved enrollment is the number of new students the Board has approved a program to admit, not the number who actually enrolled; statewide, programs enrolled 19,365 new students in 2024–25.
Methodology and sources
- What the BRN measures. Every BRN-approved pre-licensure program completes the Board’s annual school survey, run by the University of California, San Francisco. All 145 schools offering 156 programs responded for 2024–25. The academic year runs August 1 to July 31.
- Acceptance rate. Accepted applications ÷ qualified applications, exactly as the BRN publishes it in Table 3. We recalculated every year’s percentage from the counts and they match the published figures to within 0.1 point.
- Program types. “ADN” in the single-year tables means generic ADN programs; LVN-to-ADN is shown separately. BSN totals include LVN-to-BSN applicants. The ten-year trend report combines generic ADN and LVN-to-ADN.
- No estimates. We don’t estimate individual applicants, per-school acceptance rates or current regional figures, because the BRN doesn’t publish them.
- Reproducible. Figures are parsed directly from the BRN PDFs. The full dataset with page references (JSON) and a CSV are available. Spot an error? See our corrections policy.
| Source | Used for | Pages |
|---|---|---|
| 2024–2025 Annual School Report: Data Summary for Pre-Licensure Nursing Programs (BRN/UCSF, Aug 2026) | 2024–25 applications, acceptances, enrollments, spaces, selection methods, waitlists | Tables 2–5: pp. 3–4; Tables 47–48: pp. 35–36 |
| 2024–2025 Annual School Report: Data Summary and Trend Analysis | Ten-year qualified applications and enrollments | Tables 4–6: pp. 5–7 |
| Data Summary for Pre-Licensure Nursing Programs, 2015–16 to 2023–24 (nine reports; linked in the trend table above) | Acceptance rate by year and program type | Table 3: p. 3 of each |
| 2015–2016 regional school reports (9 regions) | Regional qualified applications and enrollments | p. 4 of each |
| Pre-Licensure RN Programs | Approved annual enrollment per program | Web table |
All sources retrieved Oct 7, 2026 from the California Board of Registered Nursing website. The BRN’s Tableau school-survey dashboard was down for maintenance when we checked.
How to cite this data
Suggested citation: SEAPHE. (2026). California pre-licensure RN program applications and acceptances, 2015–16 to 2024–25 [Data set]. Compiled from the California Board of Registered Nursing Annual School Report. https://seaphe.org/admissions/ (updated Oct 7, 2026).
Original source: 2024-2025 Annual School Report: Data Summary for Pre-Licensure Nursing Programs (BRN / UCSF, Aug 24, 2026); 2024-2025 Pre-Licensure Nursing Program Annual School Report: Data Summary and Historical Trend Analysis (BRN / UCSF).
Frequently asked questions
What is the acceptance rate for nursing school in California?
In 2024–25, California’s pre-licensure RN programs accepted 20,556 of 64,075 qualified applications, or 32.1%. By program type: generic ADN 35.0%, BSN 29.9%, ELM 33.6% and LVN-to-ADN 56.2%. These are shares of applications, not applicants.
Is it harder to get into a BSN or an ADN program in California?
By the BRN’s numbers, BSN programs accepted a smaller share of qualified applications in 2024–25 (29.9% vs. 35.0% for generic ADN). But many community college ADN programs use lotteries or multi-criteria points, and their waitlists ran longer on average (2.8 vs. 1.2 semesters). See ADN vs. BSN in California.
Does 32.1% mean I have a one-in-three chance?
No. The figure counts applications, and most people apply to several programs. The BRN doesn’t track individual applicants, so no one knows what share of people get at least one offer. Your real odds depend on the programs you choose and how competitive your application is.
What is the acceptance rate at a specific California nursing school?
The BRN doesn’t publish per-school acceptance rates, so we don’t show them. Each school page lists the program’s BRN-approved annual enrollment. Ask the school directly for last cycle’s qualified applicants and seats.
Are entry-level master’s (ELM) programs easier to get into?
Not really. ELM programs accepted 33.6% of 3,322 qualified applications in 2024–25, about the statewide average. Admissions rely more on personal statements, references and interviews. See ELM programs explained.
Why do some programs enroll more students than they accept?
Generic ADN programs enrolled 8,237 new students from 8,043 accepted applications in 2024–25. The BRN says this usually happens because programs add students from a waitlist or admit LVNs into the second year to fill seats left by students who dropped out.
How often is this data updated?
The BRN publishes its annual school report about a year after each academic year ends. The 2024–25 report came out in August 2026. We’ll update this page when the 2025–26 report is released.
SEAPHE Editorial Team · Reviewed by a practicing registered nurse (RN, BSN). Updated Oct 7, 2026. Spot an error? See our corrections policy.